This website accompanies the ISMIR 2022 paper “Distortion Audio Effects: Learning How to Recover the Clean Signal”. Here, we provide listening examples of the restored audio excerpts generated by the models described in the paper. Additionally, we give some insights into the behavior of the models for varying input SDR levels and the relation of the evaluation metrics.
Abstract
Given the recent advances in music source separation and automatic mixing, removing audio effects in music tracks is a meaningful step toward developing an automated remixing system. This paper focuses on removing distortion audio effects applied to guitar tracks in music production.
We explore whether effect removal can be approached as a filtering task to be solved by neural networks designed for source separation and audio effect modeling. Our approach proves particularly effective for effects that mix the processed and clean signals. The models achieve better quality and significantly faster inference compared to state-of-the-art solutions based on sparse optimization. We demonstrate that the models are suitable not only for declipping but also for other types of distortion effects. By discussing the results, we stress the usefulness of multiple evaluation metrics to assess different aspects of reconstruction in distortion effect removal.
Task A: Electric Guitar
For the first task (removing distortion effects in guitar recordings), we used an internal dataset, which we refer to as CEG (Clean Electric Guitar Effects) dataset. The data was gathered from various sources, mainly commercial audio loop packages and live recordings of solo guitar playing.
CEG-OD
To create the processed input dataset CEG-OD, the SoX overdrive algorithm was applied to the data using five uniformly sampled gain levels in the range of γ ∈ [20, 50] dB.
Results
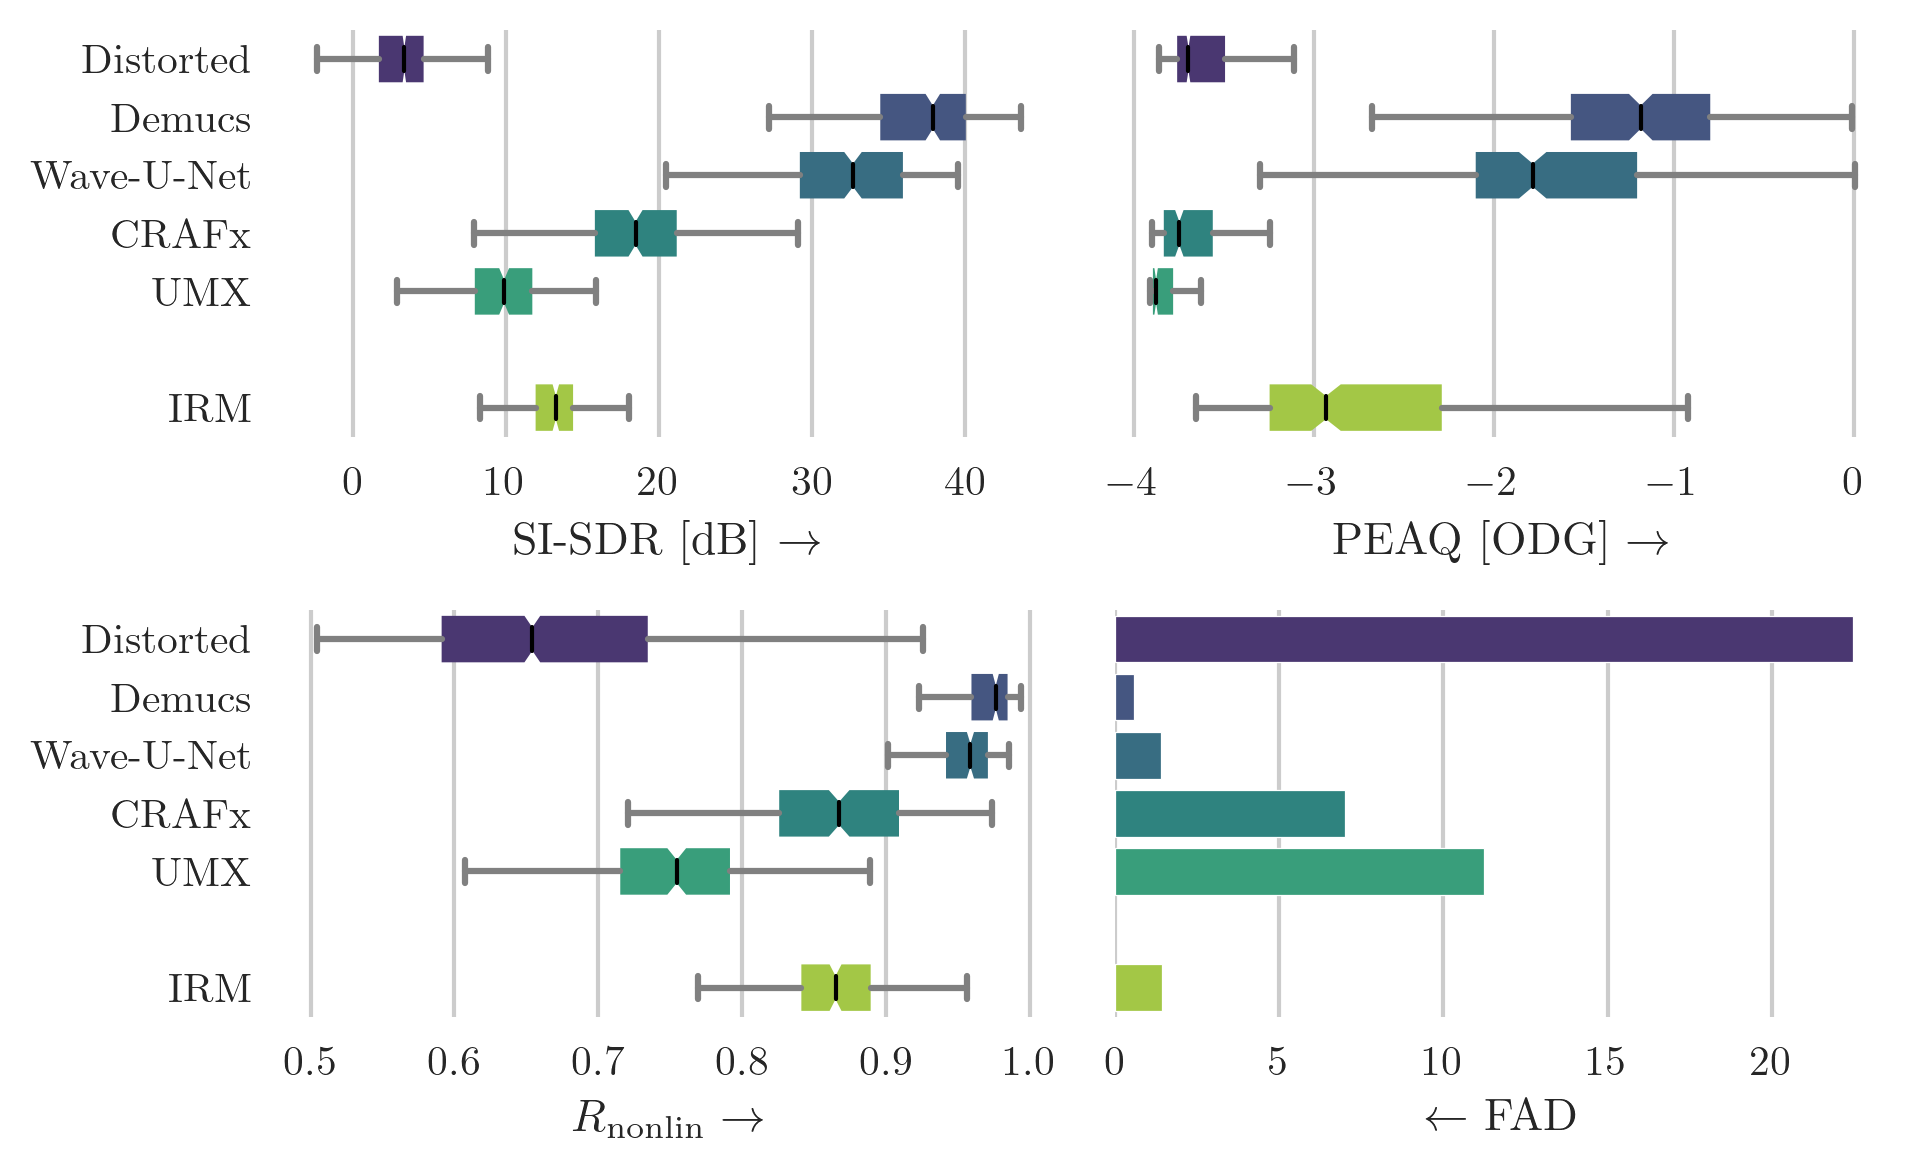 Box plot of scores for the CEG-OD dataset that was augmented using the overdrive algorithm. The boxes show the first and third quartile of the data while the median is indicated with a line in the box. Higher score indicates superior performance except for FAD. Demucs can be regarded as the best model for all metrics. The results indicate that time-domain-based models are better suited to solve the task of overdrive removal.
Audio Examples
| Example | Distorted | Target | Demucs | Wave-U-Net | CRAFx | UMX | IRM |
| A | |||||||
| B | |||||||
| C | |||||||
| D |
All examples were normalized to -19 dB LUFS according to ITU-R BS.1770-4.
CEG-HC
Similar to the procedure for CEG-OD, the input dataset for the hard-clipping task, CEG-HC, was created using hard-clipping and five uniformly-sampled gain levels in the range of γ ∈ [20, 50] dB, respectively.
Results
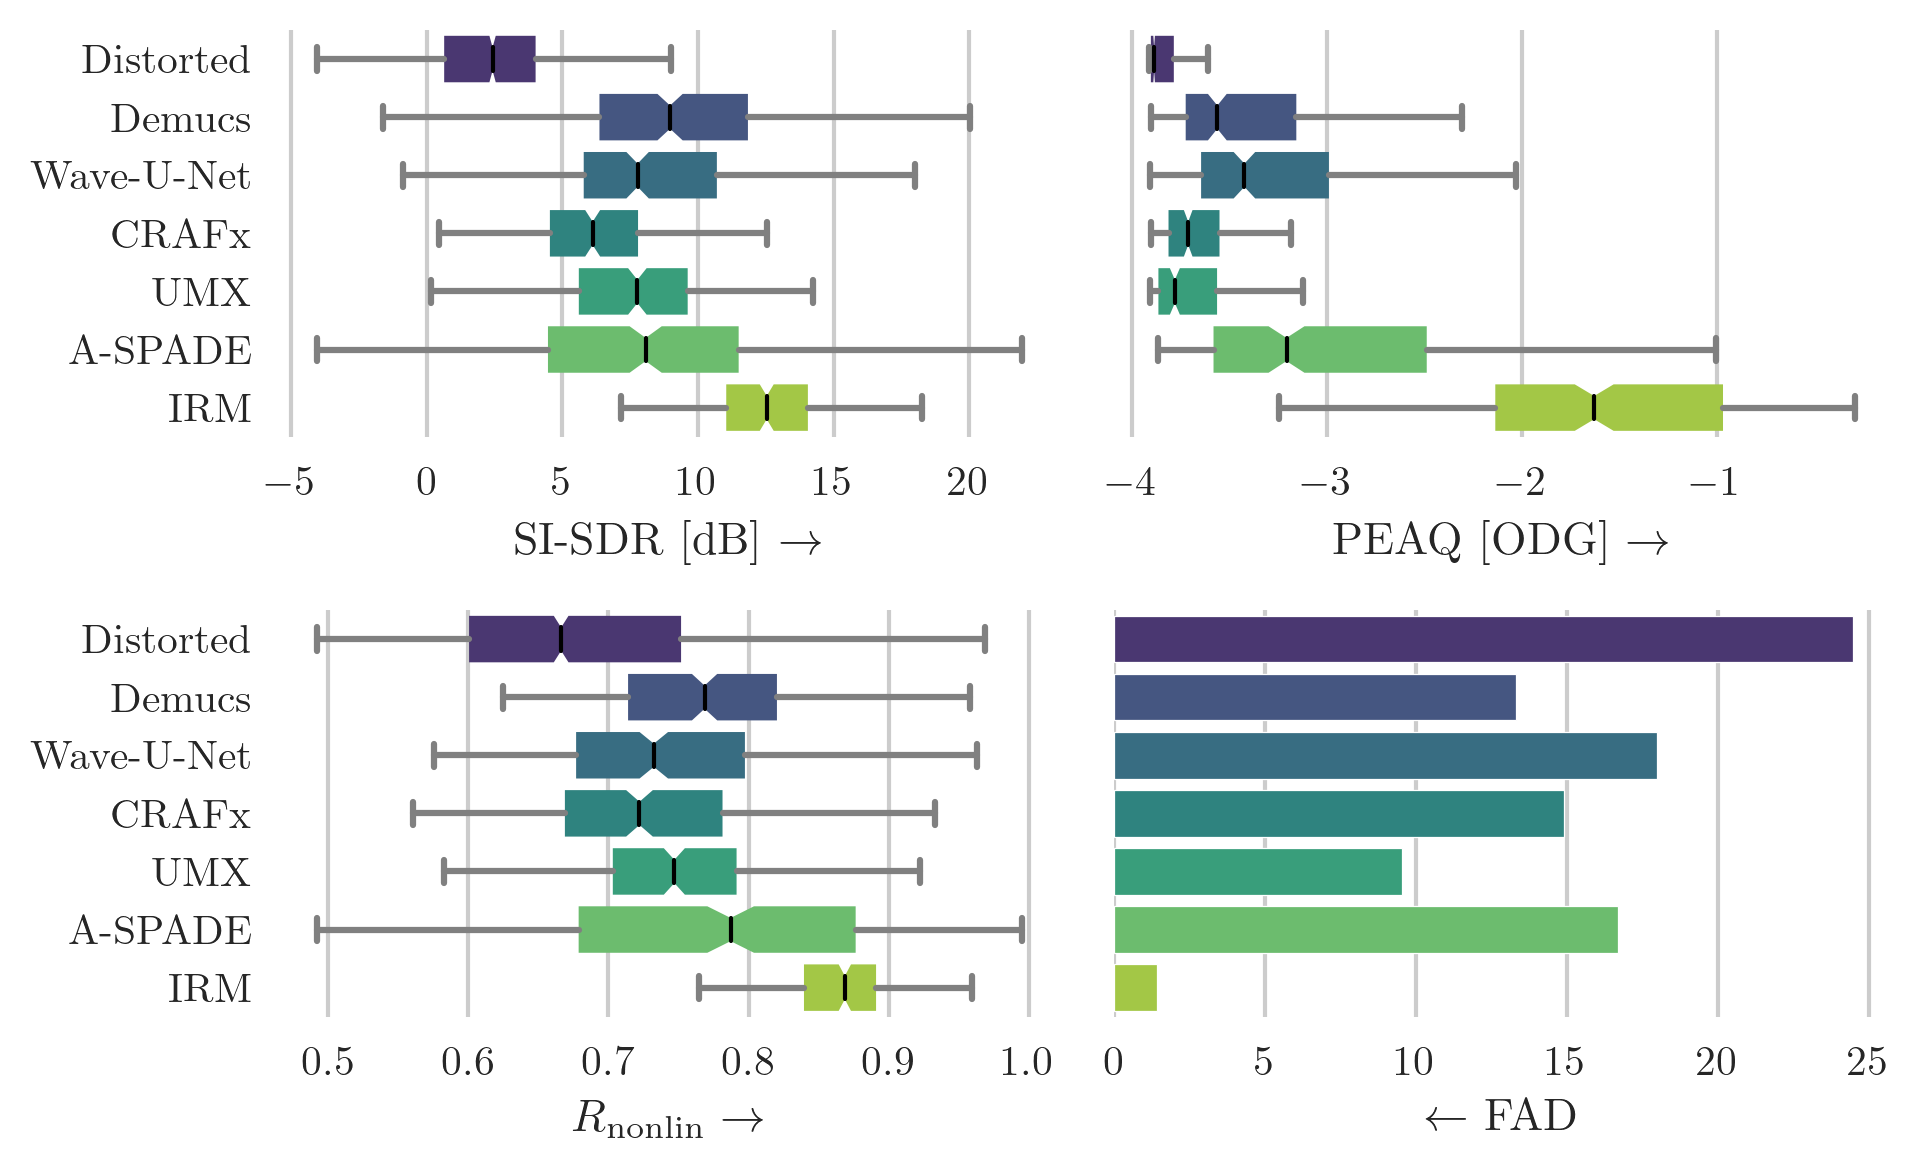 Box plot of scores for the CEG-HC dataset that was augmented using the hard-clipping algorithm. The boxes show the first and third quartile of the data while the median is indicated with a line in the box. Higher score indicates superior performance except for FAD. It is difficult to clearly determine the best model, although Demucs represents a good compromise for all the metrics.
Audio Examples
| Example | Distorted | Target | Demucs | Wave-U-Net | CRAFx | UMX | A-SPADE |
| A | |||||||
| B | |||||||
| C | |||||||
| D |
All examples were normalized to -19 dB LUFS according to ITU-R BS.1770-4.
Task B: SignalTrain
Although CEG represents a good source of data for our experiments due to its specificity of instrument, it remains a limited resource in terms of size, variety and realism. Before attempting to train a system to handle recordings in real environments (e.g., a commercial song), we need to investigate how the current models at our disposal handle the availability of more and diverse training data. For this purpose, we also performed experiments on the SignalTrain dataset, which consists of more than 24 hours of music and randomly-generated test sounds.
By applying hard-clipping to this clean data, we created SignalTrain-HC. In contrast to CEG-HC and CEG-OD, hard-clipping was applied using a uniformly-sampled input SDR value in the range SDRinp ∈ [1, 20] dB. During the evaluation stage, we applied each input SDR in the set SDRinp ∈ {1,3,5,7,10,15,20} dB to each sample in the test set.
Results
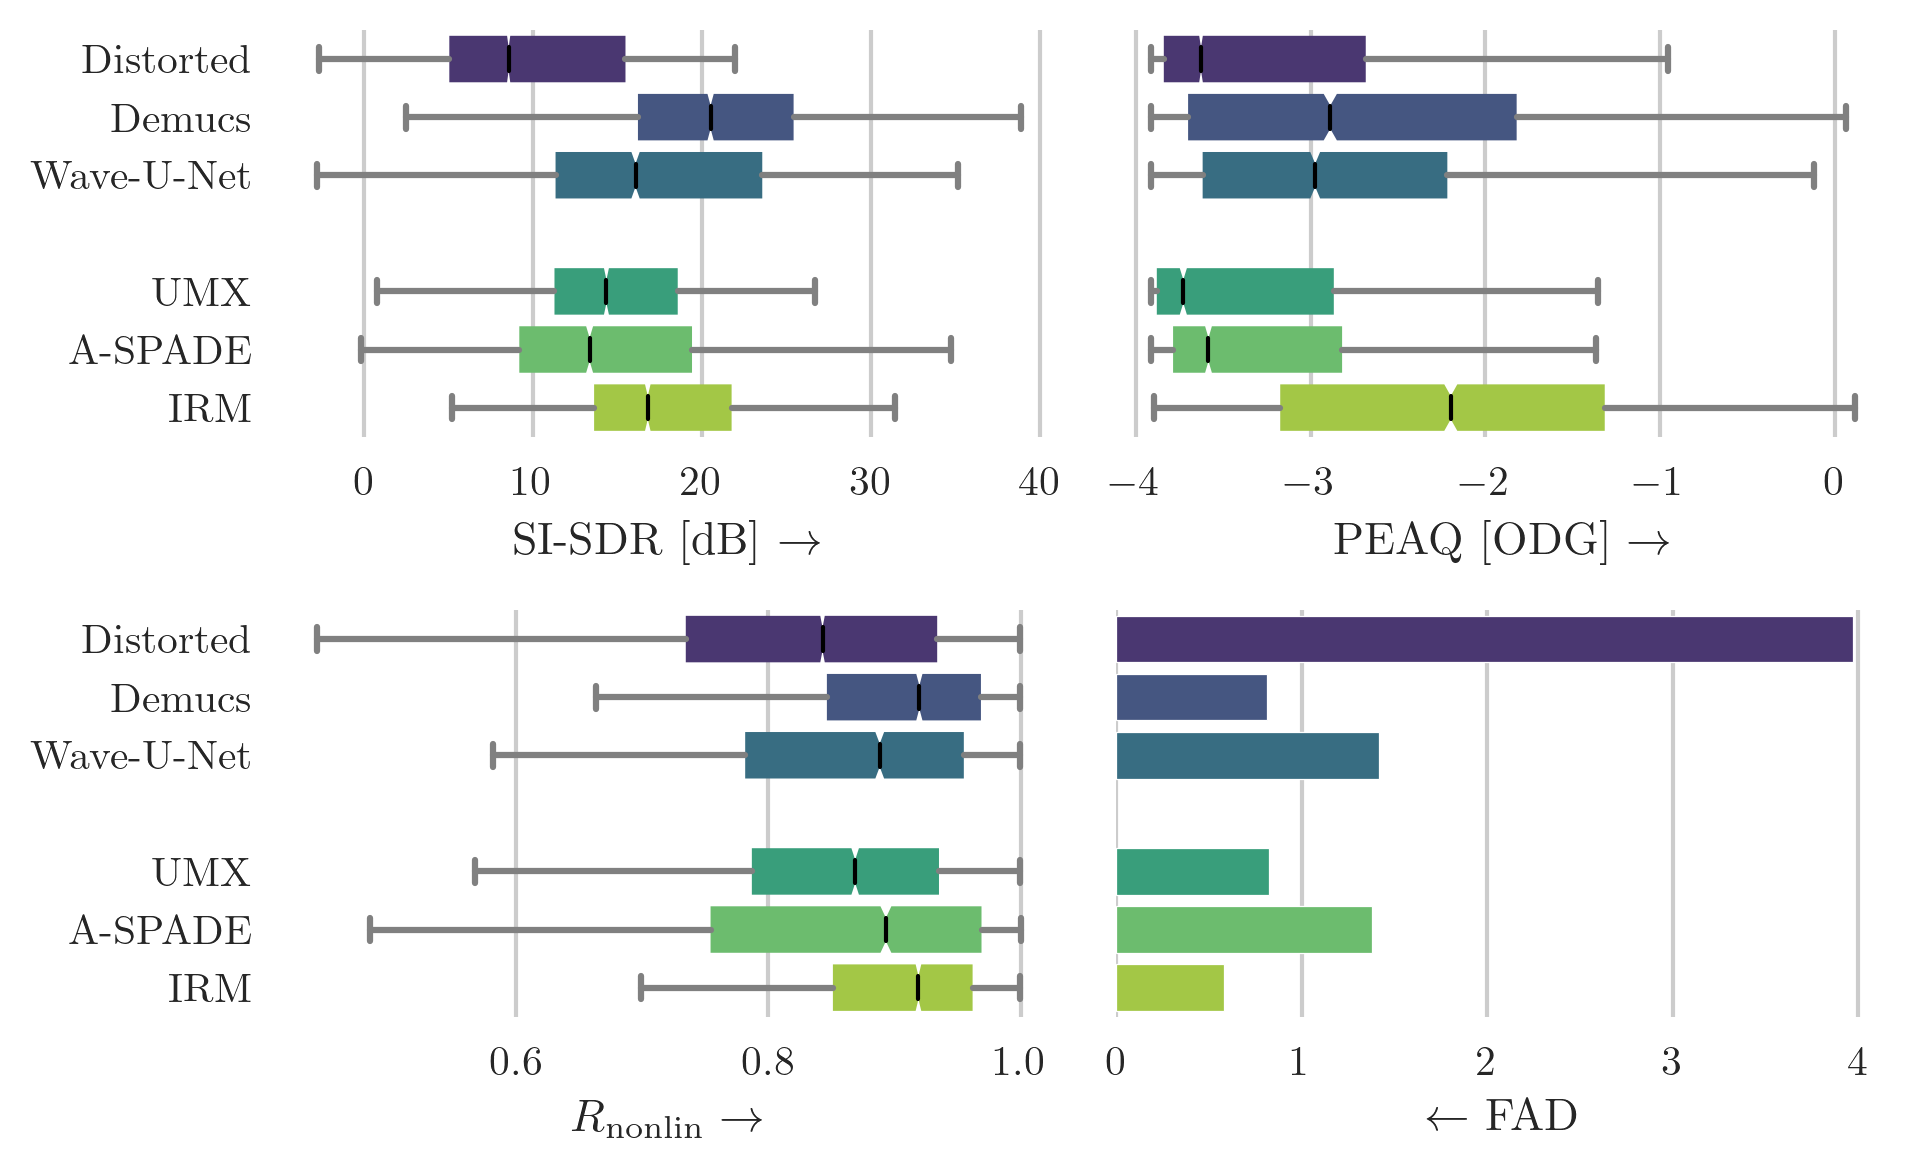 Box plot of scores for the SignalTrain-HC dataset that was augmented using the hard-clipping algorithm. The boxes show the first and third quartile of the data while the median is indicated with a line in the box. Higher score indicates superior performance except for FAD. Demucs can be regarded as the best model regarding the median score across all metrics.
Audio Examples
| Example | Distorted | Target | Demucs | Wave-U-Net | UMX | A-SPADE | IRM |
| A | |||||||
| B | |||||||
| C | |||||||
| D |
All examples were normalized to -23 dB LUFS according to ITU-R BS.1770-4.
Dependency on Input SDR
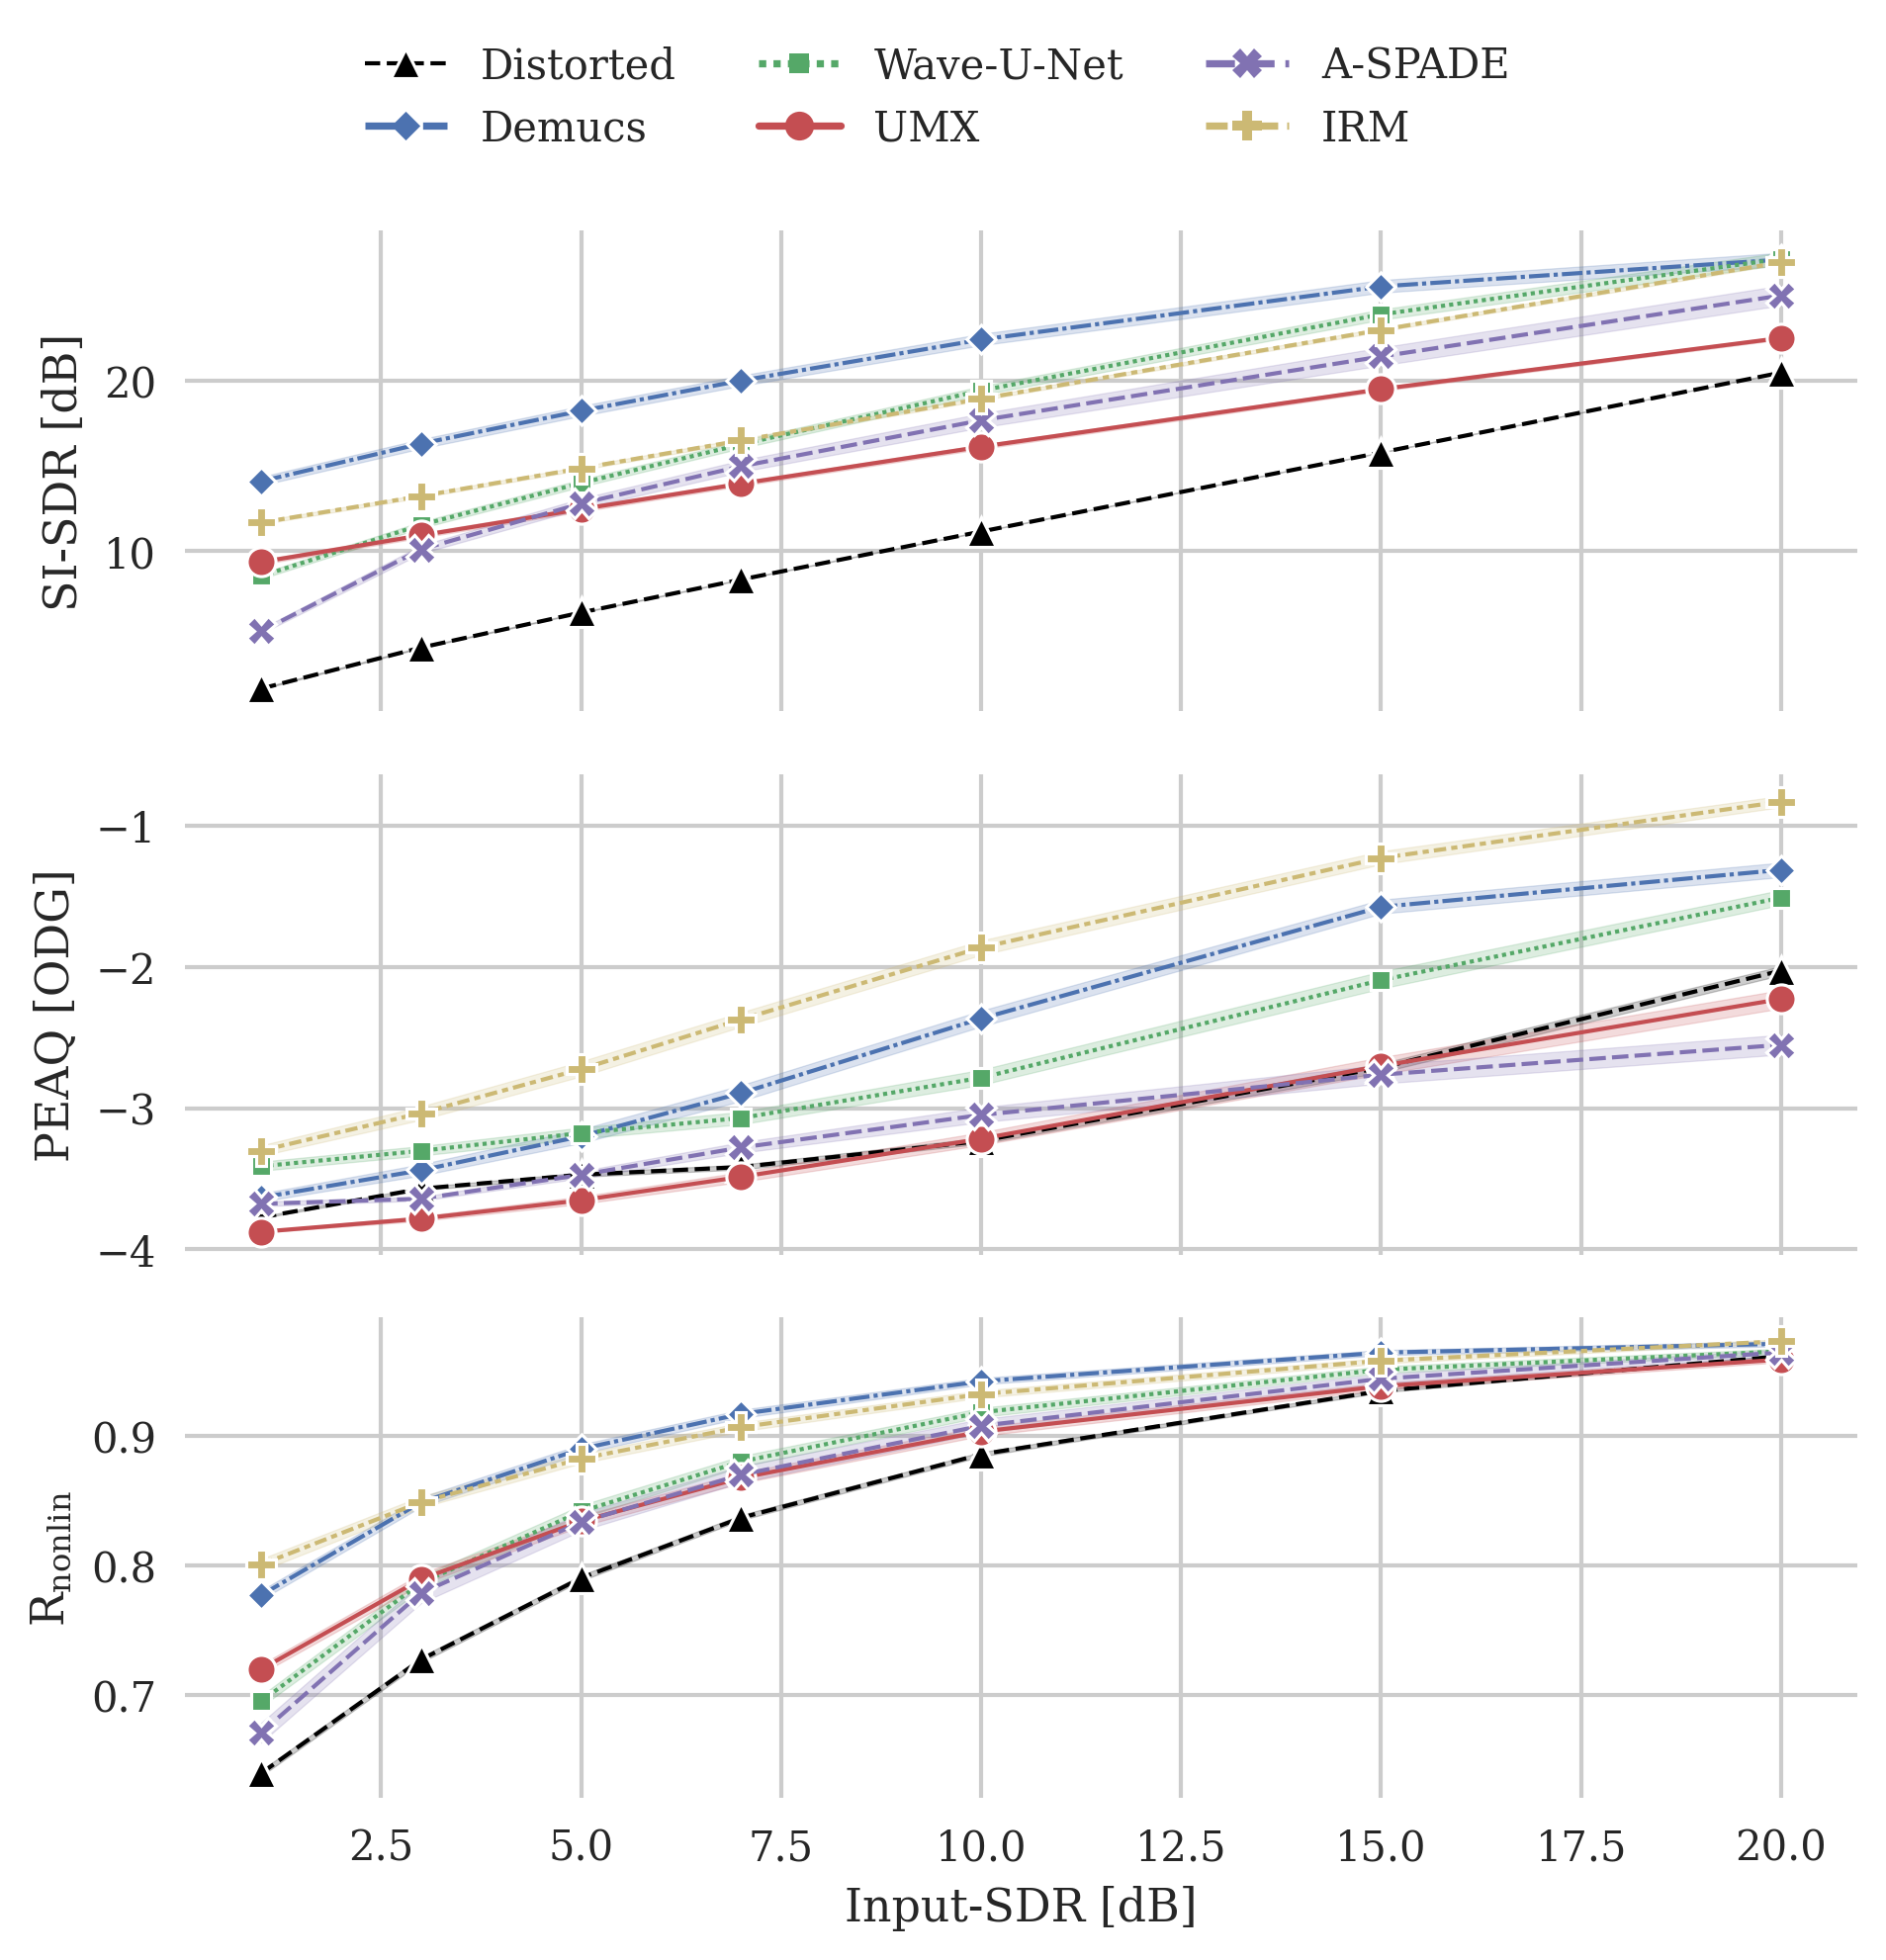 Mean scores obtained from the SignalTrain-HC dataset in comparison with the input SDR. The 95 % confidence interval is depicted with a light colored area around each line. Additionally, the black, dashed line depicts the respective score for the distorted input signals. A-SPADE’s performance drops significantly towards heavily clipped signals with a SDRinp of 1 dB; the neural models do not exhibit such a behavior.
In order to investigate the performance of the models as a function of the amount of distortion present in the input signal, the figure above shows the scores for SI-SDR, PEAQ, and R-nonlin for varying SDR-inp.
The results suggest that the relationship between SDR-inp and SI-SDR is approximately linear. A-SPADE is the only exception, since for low SDR-inp values (i.e., for highly distorted inputs) the performance drops significantly (left side in the figure). This performance decrease has been reported previously in the literature for various declipping algorithms [11, 13]. At the same time, we see all models decrease the SI-SDR improvement for high SDR-inp (i.e., right side in the figure): since the input signal presents low distortion, there is also less margin for improvement.
We observe a non-linear relationship between SDR-inp and PEAQ, as the curve’s slope increases with higher SDR-inp. This is due to PEAQ not being able to distinguish clearly signals with large impairment.
Furthermore, we notice a non-linear relationship between R-nonlin and SDR-inp, which resembles a logarithmic behavior. R-nonlin does not saturate for high distortion, which makes it a good candidate for the comparison of significantly clipped signals. However, it does saturate for low distortions, therefore cannot be used reliably when the input signal is only slightly clipped.
Evaluation Metrics
 |
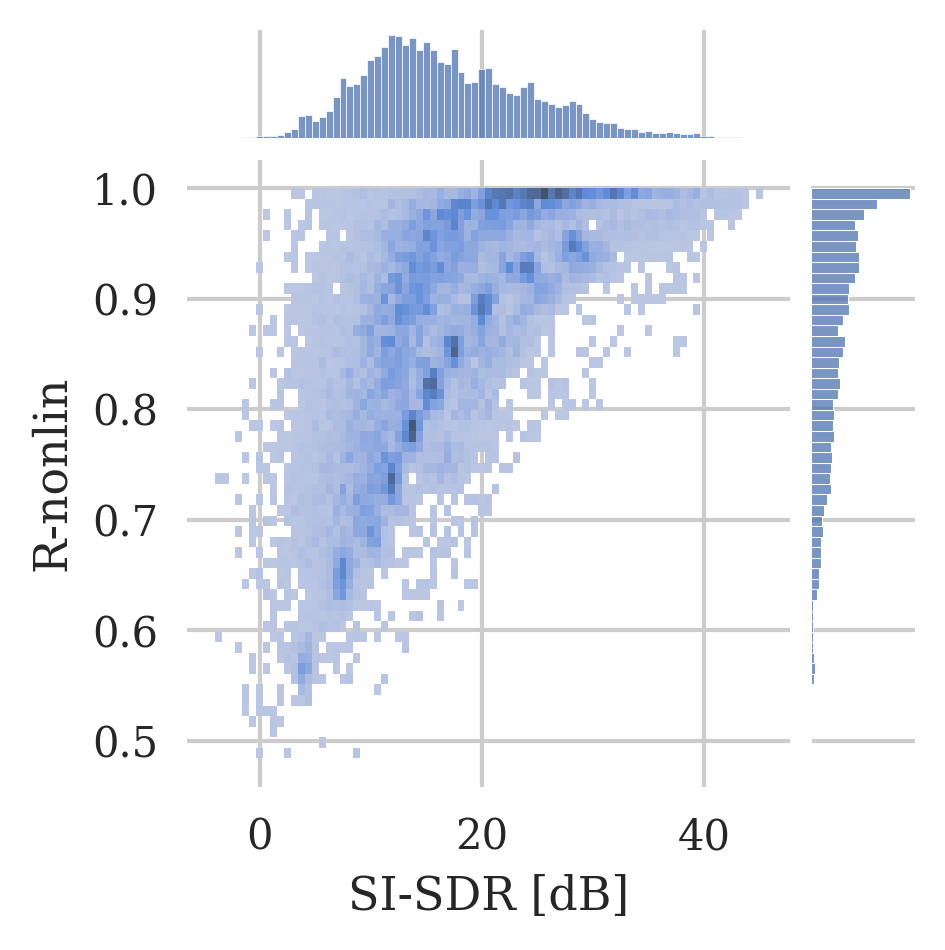 |
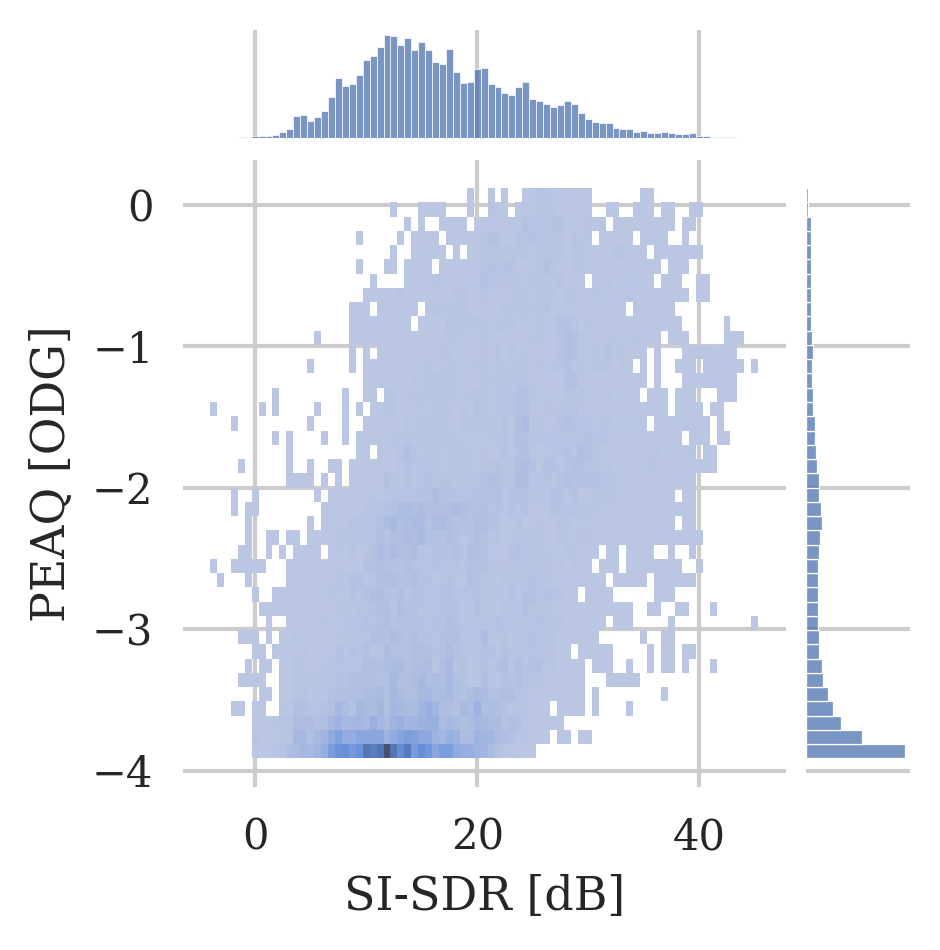
Histogram plot of the PEAQ and R-nonlin scores in comparison with the SI-SDR scores for all datasets and methods.
To further motivate the choice of the four evaluation metrics in this work, for PEAQ, the plot further highlights the saturating behaviour towards strong clipping as a large proportion of values can be found at the negative limit of the ODG scale. Similarly, for R-nonlin, the plot substantiates the logarithmic relation to the SI-SDR, as well as the problem of not differentiating clearly between slightly clipped signals.
Citation
@inproceedings{imort_distortion_2022,
    address = {Bengaluru, India},
    title = {Distortion {Audio} {Effects}: {Learning} {How} to {Recover} the {Clean} {Signal}},
    booktitle = {Proc. of the 23rd {International} {Society} for {Music} {Information} {Retrieval} {Conference}},
    author = {Imort, Johannes and Fabbro, Giorgio and Martínez Ramírez, Marco A. and Uhlich, Stefan and Koyama, Yuichiro and Mitsufuji, Yuki},
    year = {2022}},
  }